
Documenting your 3D printing activities offers a powerful pathway to understanding your workflow, optimizing your resources, and building a more confident approach to the hobby. By systematically recording key information about each print, you can unlock valuable insights that might otherwise remain hidden, leading to significant savings in time and money. This practice transforms the often trial-and-error nature of 3D printing into a data-driven process, empowering you with knowledge and control.
The benefits of this meticulous approach are multifaceted. Firstly, it provides a clear overview of your printing habits and material consumption. This allows for more accurate budgeting and ensures you never face the frustrating situation of running out of filament mid-project. Secondly, analyzing this data helps identify patterns in supply usage, pinpoint successful print settings, and track your overall progress and improvement. This proactive understanding reduces the likelihood of costly mistakes and minimizes the feeling of being overwhelmed by the complexity of the printing process.
The Power of Data: Saving Time, Money, and Stress
When you begin to analyze your 3D printing data, the immediate impact is often a noticeable reduction in wasted resources. By tracking filament usage, you can anticipate when a spool is nearing its end and reorder in advance, avoiding production delays and last-minute rushes. Furthermore, documenting the settings that yield the best results for specific materials and models allows you to replicate success and avoid repeating errors. This knowledge is invaluable for streamlining your workflow and ensuring consistent quality.
Beyond practical savings, observing improvements reflected in your data can be incredibly motivating. Tweaking a nozzle temperature or adjusting bed adhesion settings and then seeing a corresponding increase in print success rates or a decrease in print times provides tangible evidence of your growing expertise. Even seemingly minor adjustments to your process become more meaningful when backed by factual data, making each print feel like a genuine step forward in your learning journey. This data-driven approach fosters a sense of accomplishment and encourages continuous refinement.
Essential Information to Capture Before You Begin
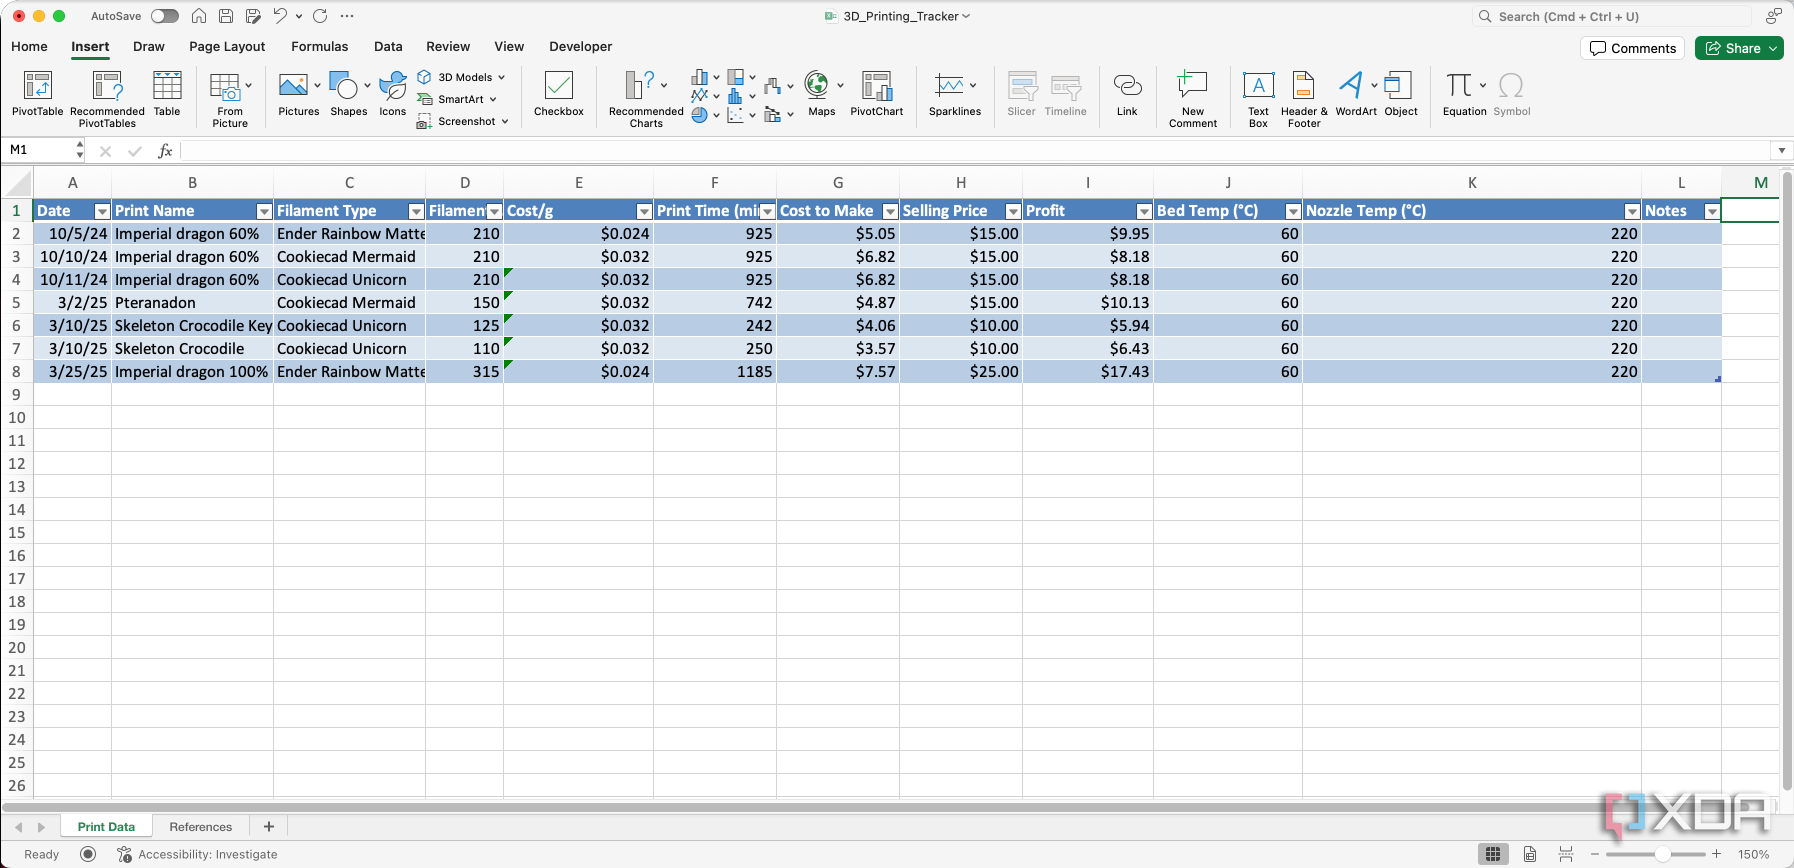
To build a comprehensive and useful record, it's crucial to gather specific details before you even start a print. This foundational data provides the context necessary for later analysis. Key information to document includes:
- Project Details: A clear name or description for the print.
- Print Time: The total duration of the printing process.
- Filament Usage: The amount of filament consumed, often measured in grams or meters.
- Temperature Settings:
- Bed Temperature
- Nozzle Temperature
- Troubleshooting Observations: Any issues encountered during the print, such as warping, stringing, layer adhesion problems, or failed prints. Detailed notes on what went wrong can be instrumental in future problem-solving.
- Printer Model: The specific make and model of your 3D printer.
- Filament Specifications:
- Filament Type (e.g., PLA, ABS, PETG, TPU)
- Brand and Color
- Any specific characteristics or notes about the filament.
Collecting this data consistently ensures your records are robust and allow for valuable comparisons over time. When a print fails, recording the specific circumstances can help diagnose recurring problems and lead to more effective solutions.
Building a Reference Sheet for Streamlined Data Entry
To further enhance efficiency, consider creating a separate reference sheet within your spreadsheet. This centralized hub will store recurring information, saving you time and preventing inconsistencies. This reference sheet can include:
- Filament Inventory:
- Filament Type and Brand
- Average Cost per Spool/Kilogram
- Recommended Printing Temperatures (min/max)
- Special Handling or Drying Instructions
- Printer Maintenance Log:
- Each printer model you own.
- Records of maintenance performed.
- Costs associated with replacement parts (e.g., nozzles, PTFE tubes).
By consistently updating this reference sheet, you can gain a clear understanding of your expenses, identify trends in material depletion, and anticipate maintenance needs. This proactive management allows for more responsible purchasing decisions and a better-prepared approach to your printing projects.
Creating Visualizations for Instant Understanding
Transforming raw numbers into visual aids is a highly effective way to interpret your 3D printing data at a glance. While simple at first, these visualizations can become increasingly sophisticated as your needs evolve. The process typically involves the following steps:
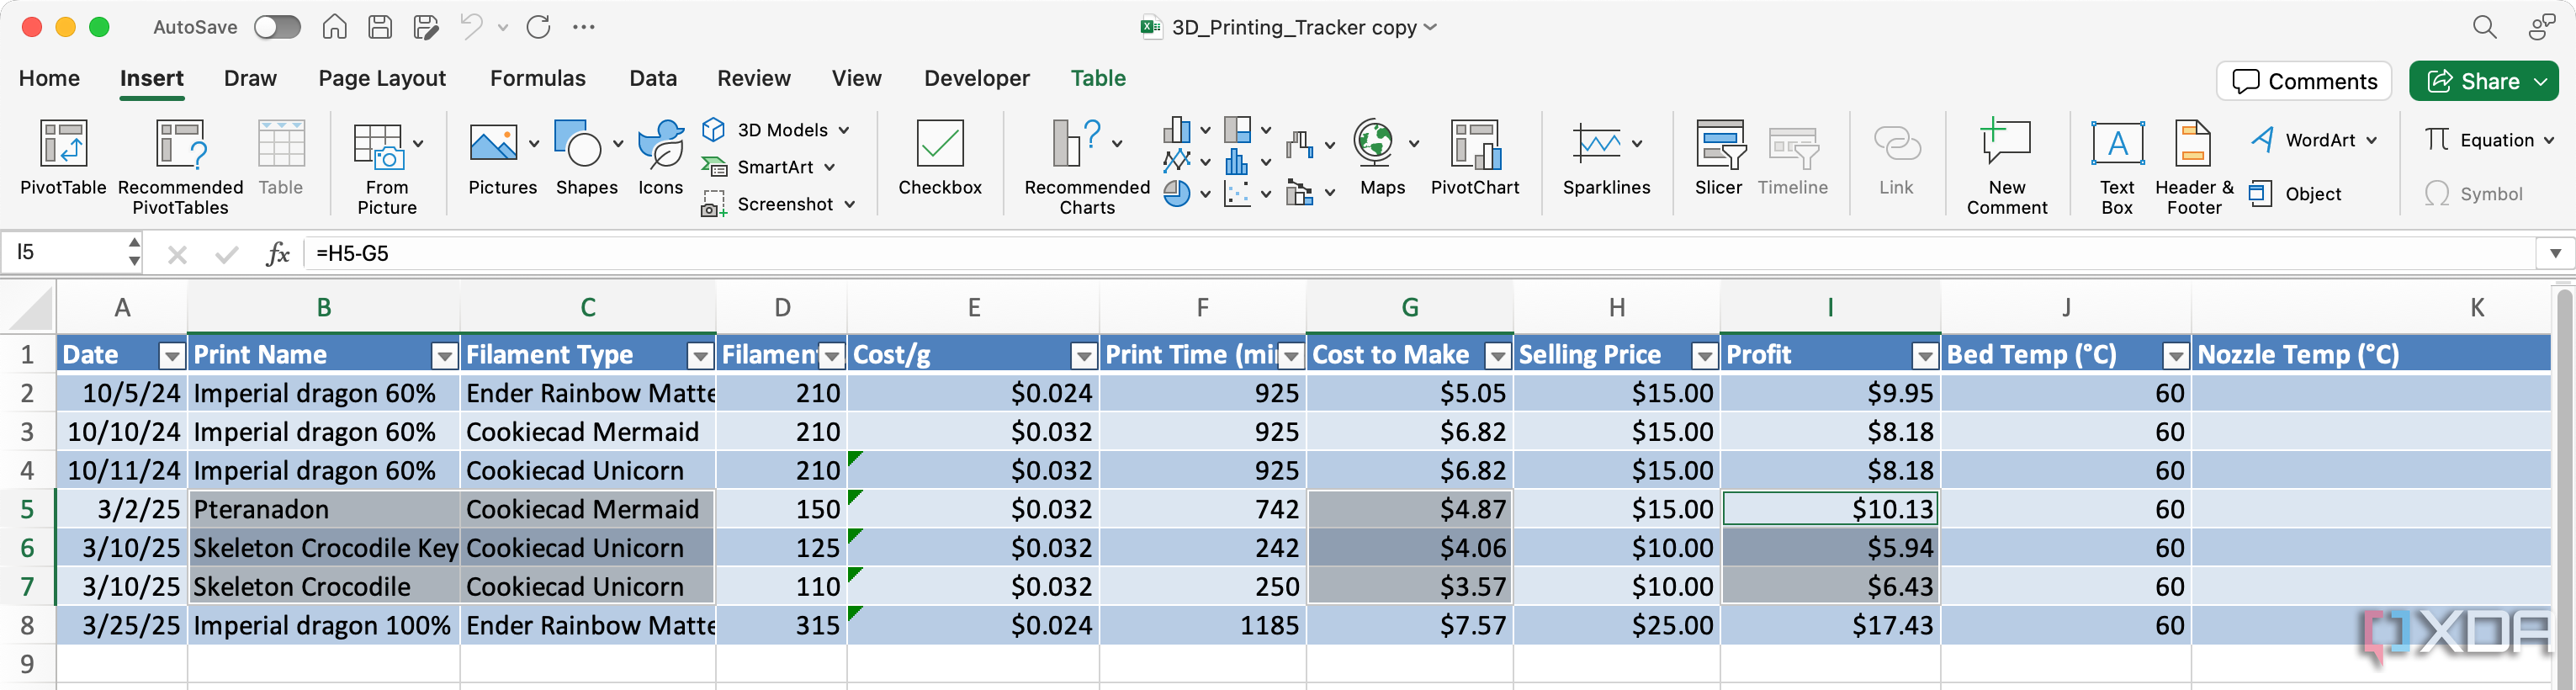
- Enter Data into Labeled Columns: Organize your spreadsheet with clear headings such as "Print Name," "Filament Type," "Filament Usage (g)," "Print Time (hours)," and "Success Rate (%)." Each row will then represent a single print job.
- Highlight Relevant Cells: Select the data you wish to visualize, including the column headers. Double-checking your selection is crucial to avoid errors in subsequent steps.
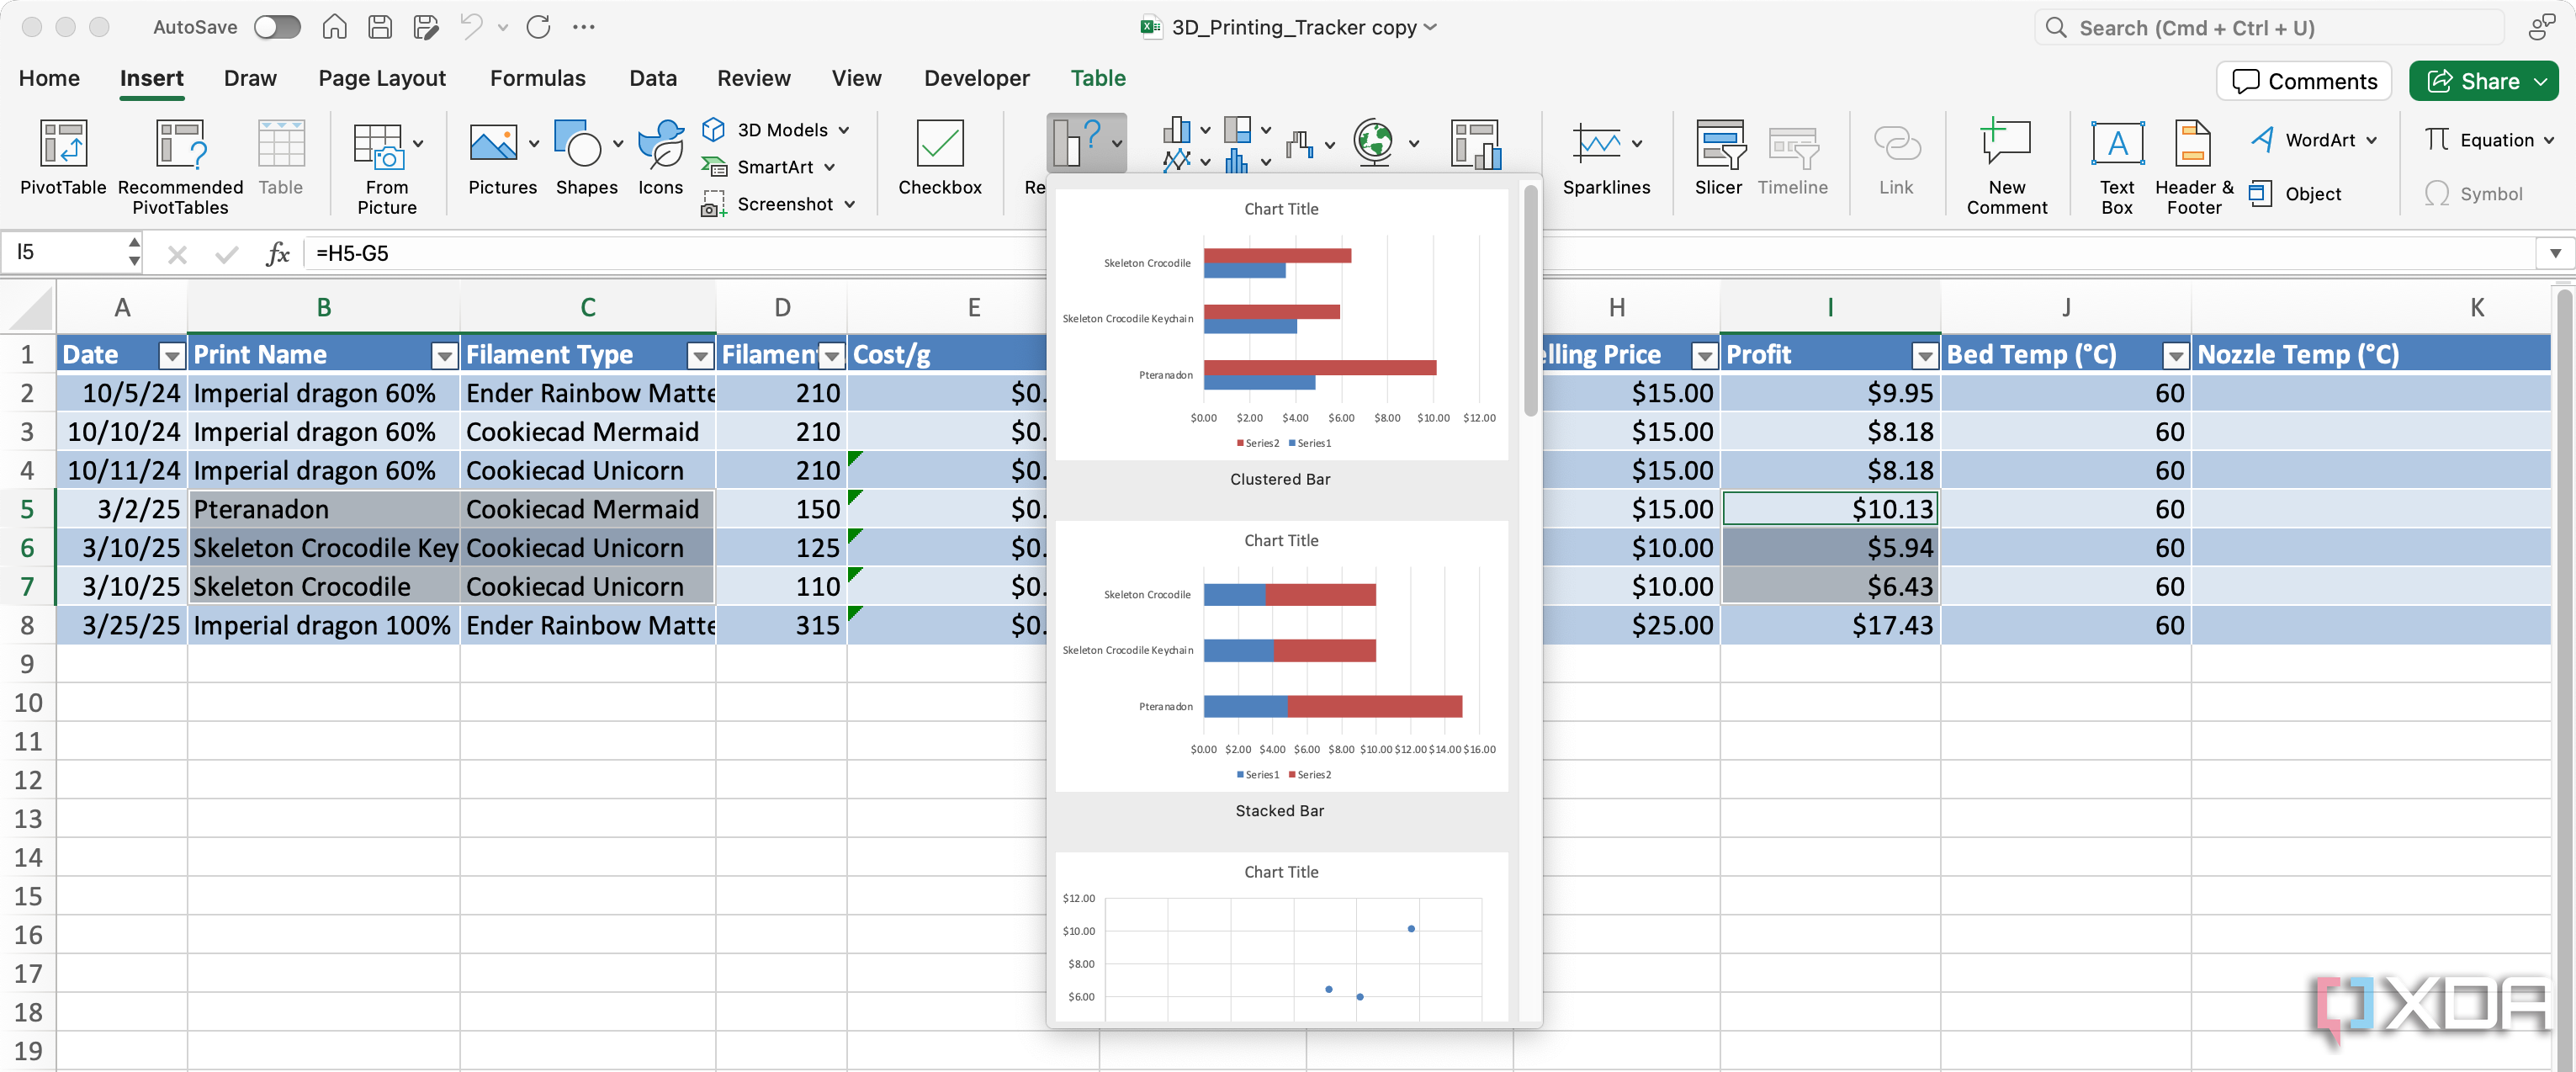
- Insert a Suitable Chart: Navigate to the "Insert" tab in your spreadsheet software and choose a chart type that best represents your data. Bar charts are excellent for comparing print times or filament usage across different projects, while pie charts can illustrate the proportion of different filament types used. Experiment with different chart types until you achieve a clear and insightful representation.
- Tweak the Chart Design: Once the chart is generated, refine its appearance for maximum clarity. Add a descriptive title, ensure axis labels are clear and informative, and consider adding data labels if they enhance readability. Small adjustments to the chart's scale, color scheme, or layout can significantly improve its effectiveness.
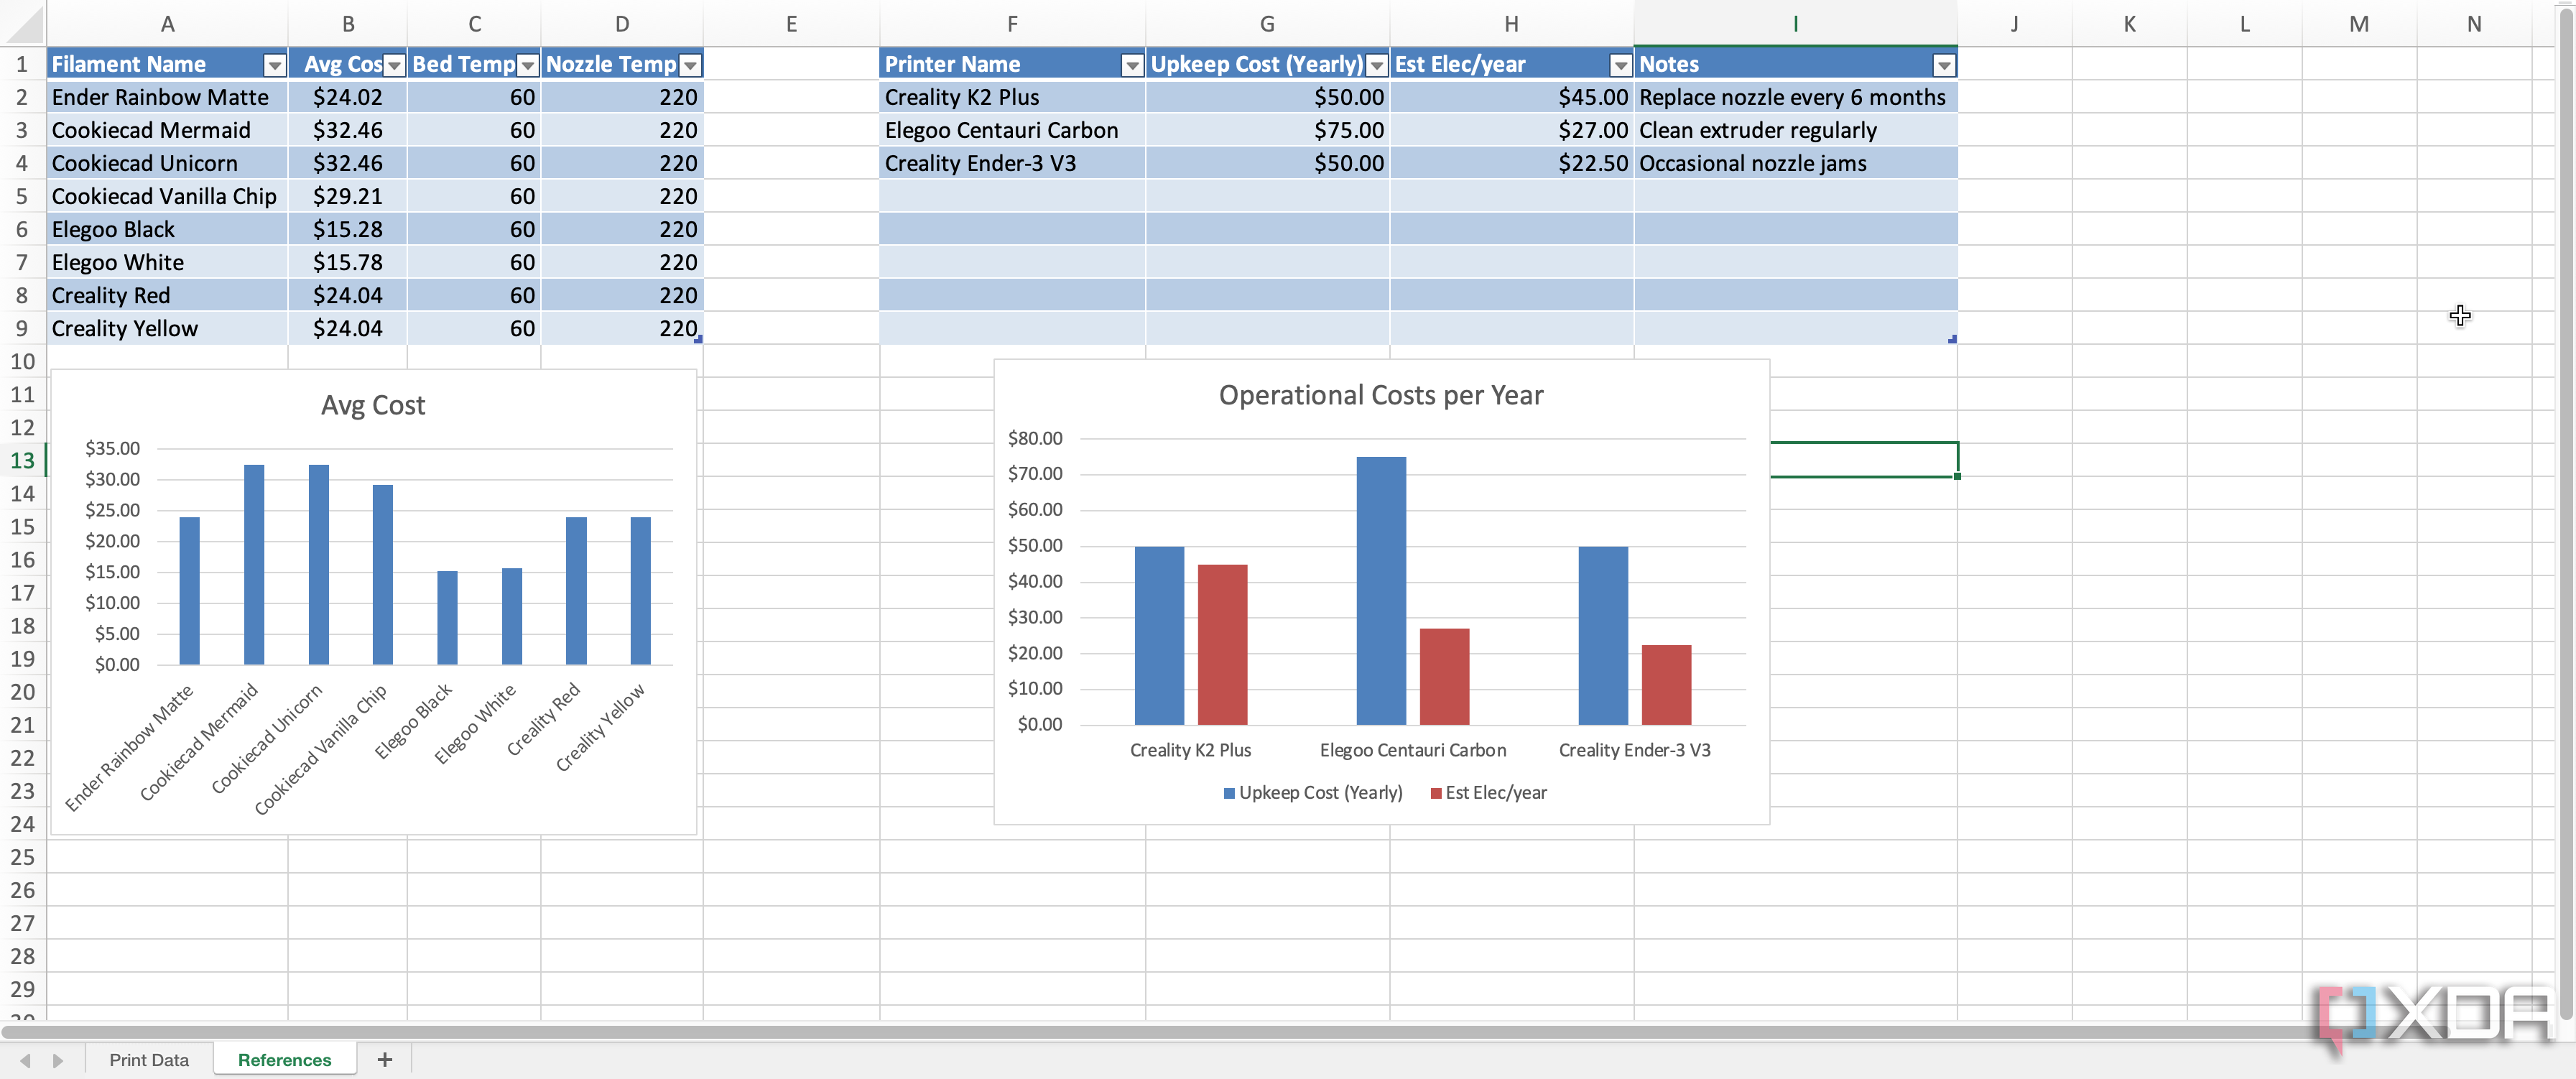
- Refine and Expand Over Time: As you gather more data or identify new metrics to track, update your spreadsheet columns and regenerate your charts. Most spreadsheet software adapts flexibly to these changes, allowing your visualizations to grow and evolve with your needs.
Excel's "Recommended Charts" feature can be a helpful starting point for selecting appropriate chart types, but don't hesitate to explore other options to best represent your data.
Key Principles for an Effective Spreadsheet
Maintaining an organized and insightful spreadsheet is fundamental to a smoother and more rewarding 3D printing experience. By consistently documenting your activities, you gain a holistic view of your material consumption, costs, and project timelines. This awareness allows for optimized print settings, reduced waste, and more realistic planning for ambitious projects. Furthermore, the ability to share your data and visualizations with fellow enthusiasts can foster a collaborative learning environment.
Ultimately, the growth of your spreadsheet mirrors the growth of your confidence and expertise. Even when faced with unexpected challenges, your documented history provides a valuable resource for identifying solutions that have proven effective in the past. A well-maintained record of prints, materials, and expenses eliminates guesswork and reduces stress, allowing you to fully enjoy the creative and rewarding aspects of 3D printing. This systematic approach ensures that every print, regardless of its outcome, contributes to your ongoing learning and mastery.


No comments:
Post a Comment