

The Debate Over AI Investment and Market Returns
Investors are currently facing a critical question: can technology companies justify their massive capital expenditures on artificial intelligence (AI) infrastructure? Or will the AI trade collapse as the market begins to realize that the return on investment (ROI) might be slower and less impactful than anticipated?
The core argument is that while the market may currently be resistant to the multibillion-dollar spending cycles in AI, investors could eventually embrace these investments when the returns start materializing. This narrative draws parallels to the early development of Amazon Web Services (AWS), where public markets initially punished heavy cloud infrastructure investments before rewarding them with significant cash flows.
However, from a capital preservation perspective, there's a structural headwind that bulls might be overlooking. Specifically, there's a permanent, multi-year dilution in corporate profitability margins for the stocks that dominate the S&P 500 ($SPX) and Nasdaq-100 ($IUXX) indexes. These companies hold such a significant portion of the market that any shift in their outlook could signal a major change in the AI-driven bull market.
The Shift in Corporate Investment
The AI revolution represents a fundamental economic regime change, with an unprecedented transfer of corporate investment dollars. Traditionally, software and internet businesses have operated at a high 90% incremental margin baseline. However, capital is now being redirected from these high-margin areas into physical AI infrastructure, which operates at a lower 50% incremental margin. This shift results in a 40% profit gap being extracted from efficient software companies and funneled into hardware and data center builders.
For example, Amazon (AMZN) consistently generates a 29% cash return on capital by leveraging low borrowing rates. Meanwhile, the broader market's earnings power is shifting toward a less profitable, hyper-competitive infrastructure layer. This marks a transition from a tide that lifts all boats to a more distinct separation between winners and losers.
Technical Analysis and Market Signals
From a technical analysis standpoint, the market provides valuable insights. One of the key charts to watch is the iShares Expanded Tech-Software Sector ETF (IGV). It presents a potential turnaround opportunity, though it remains a higher-risk trade. The ETF’s price range assumptions suggest a possible standoff, with no clear signal yet.
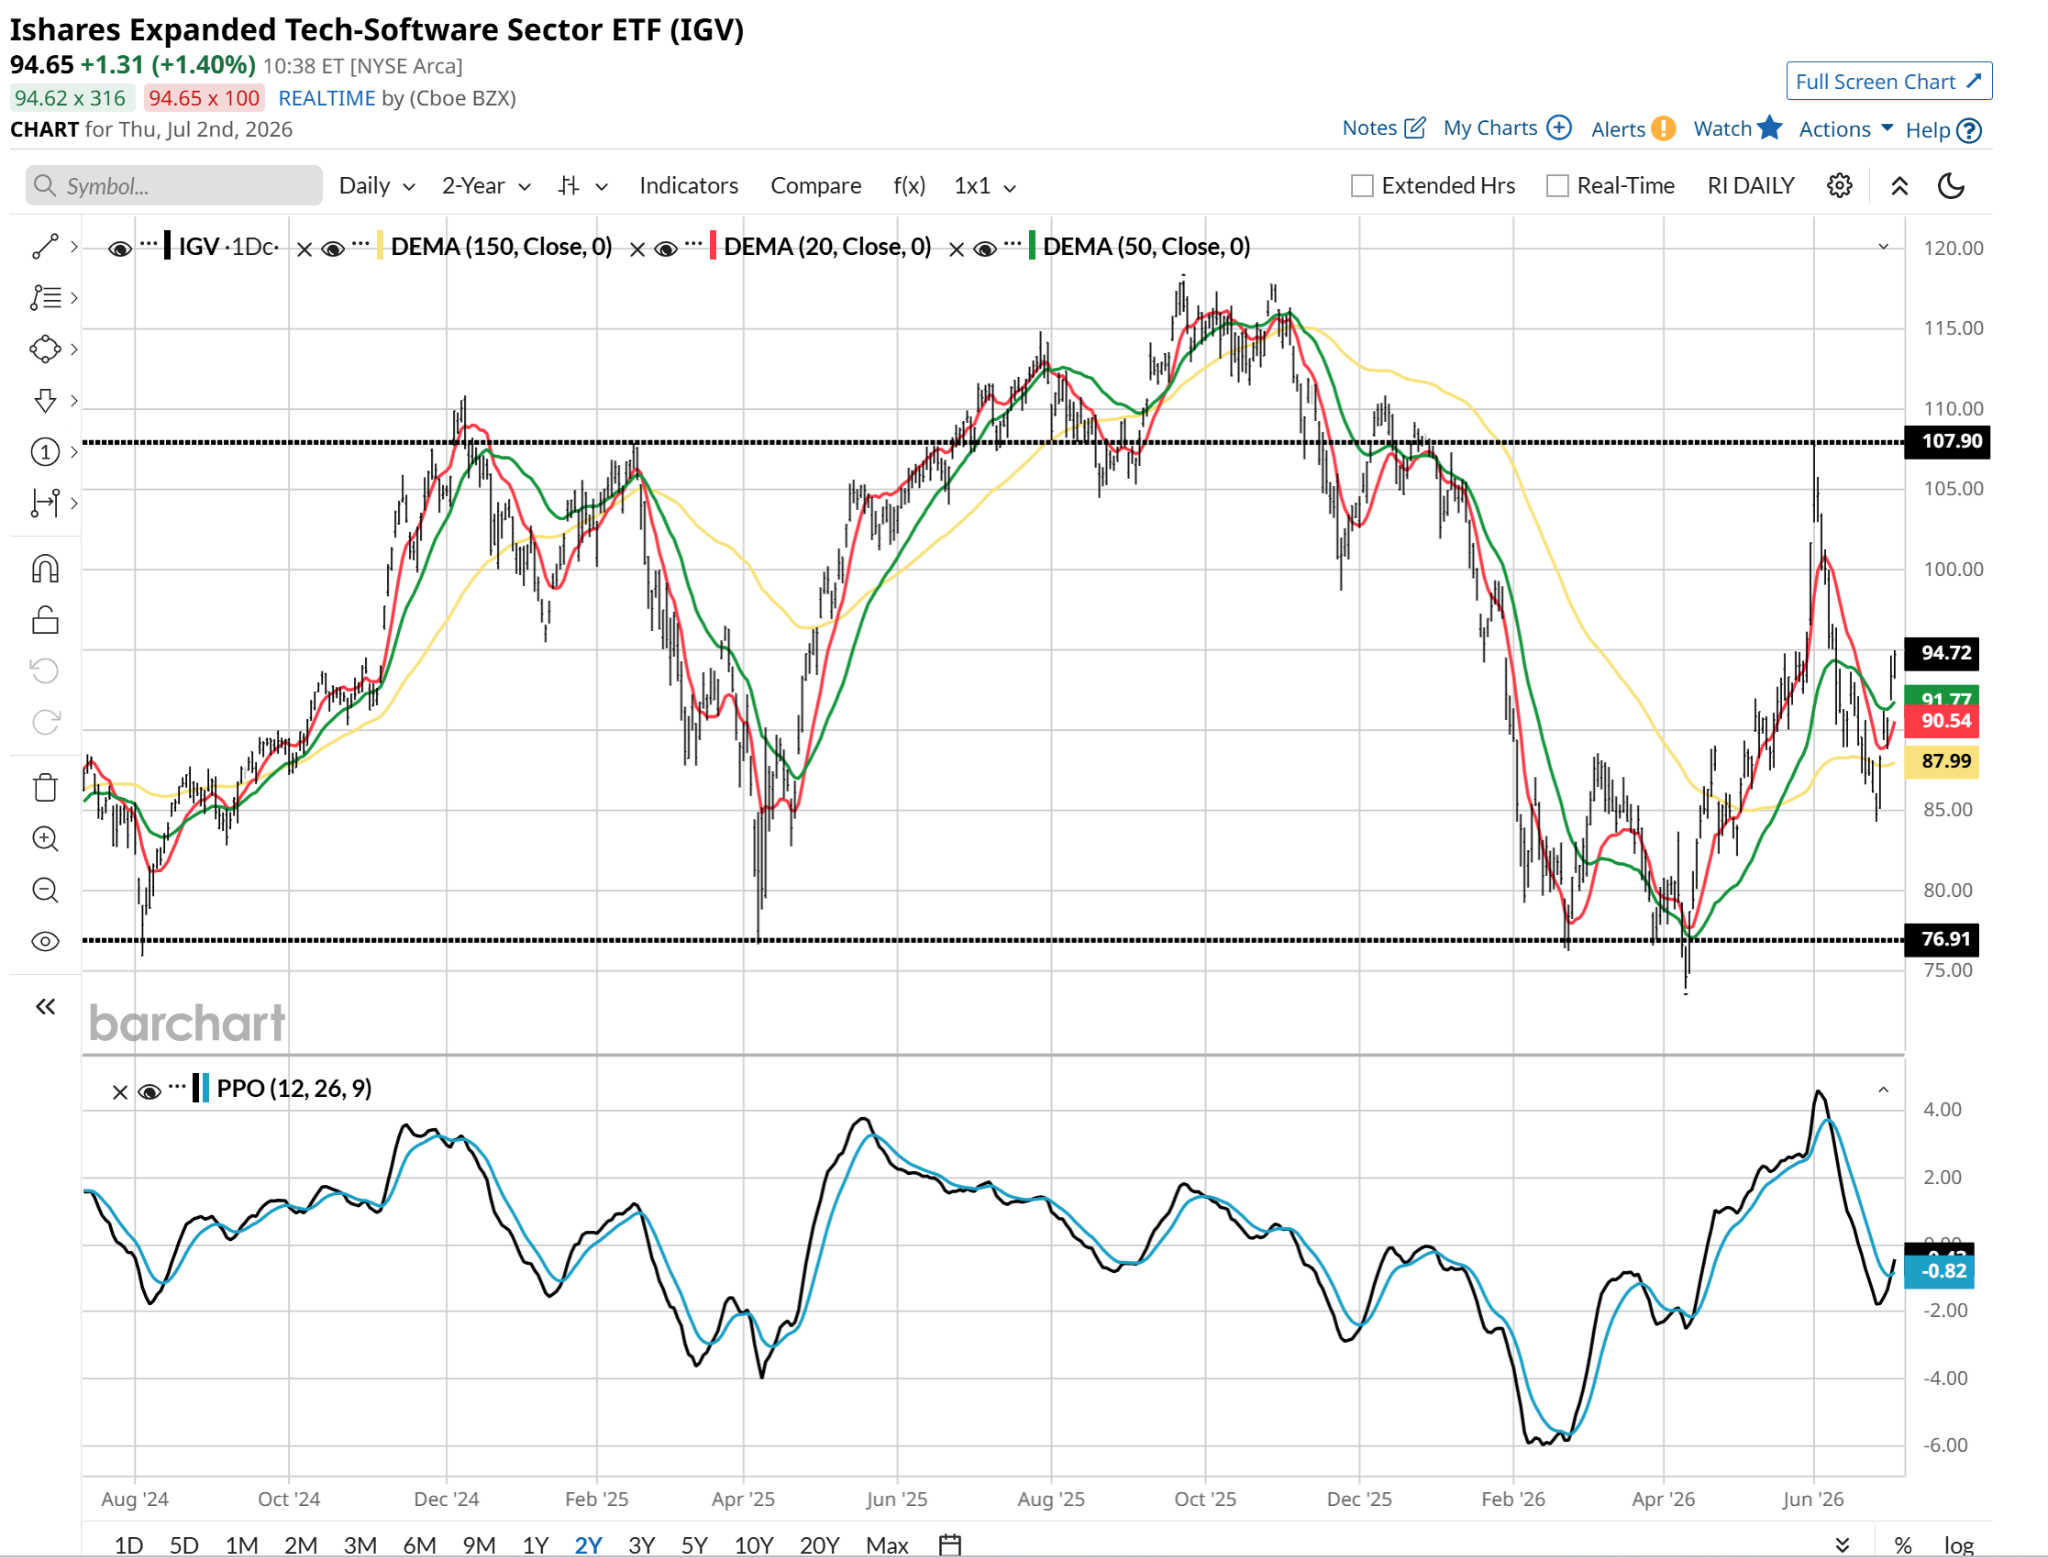
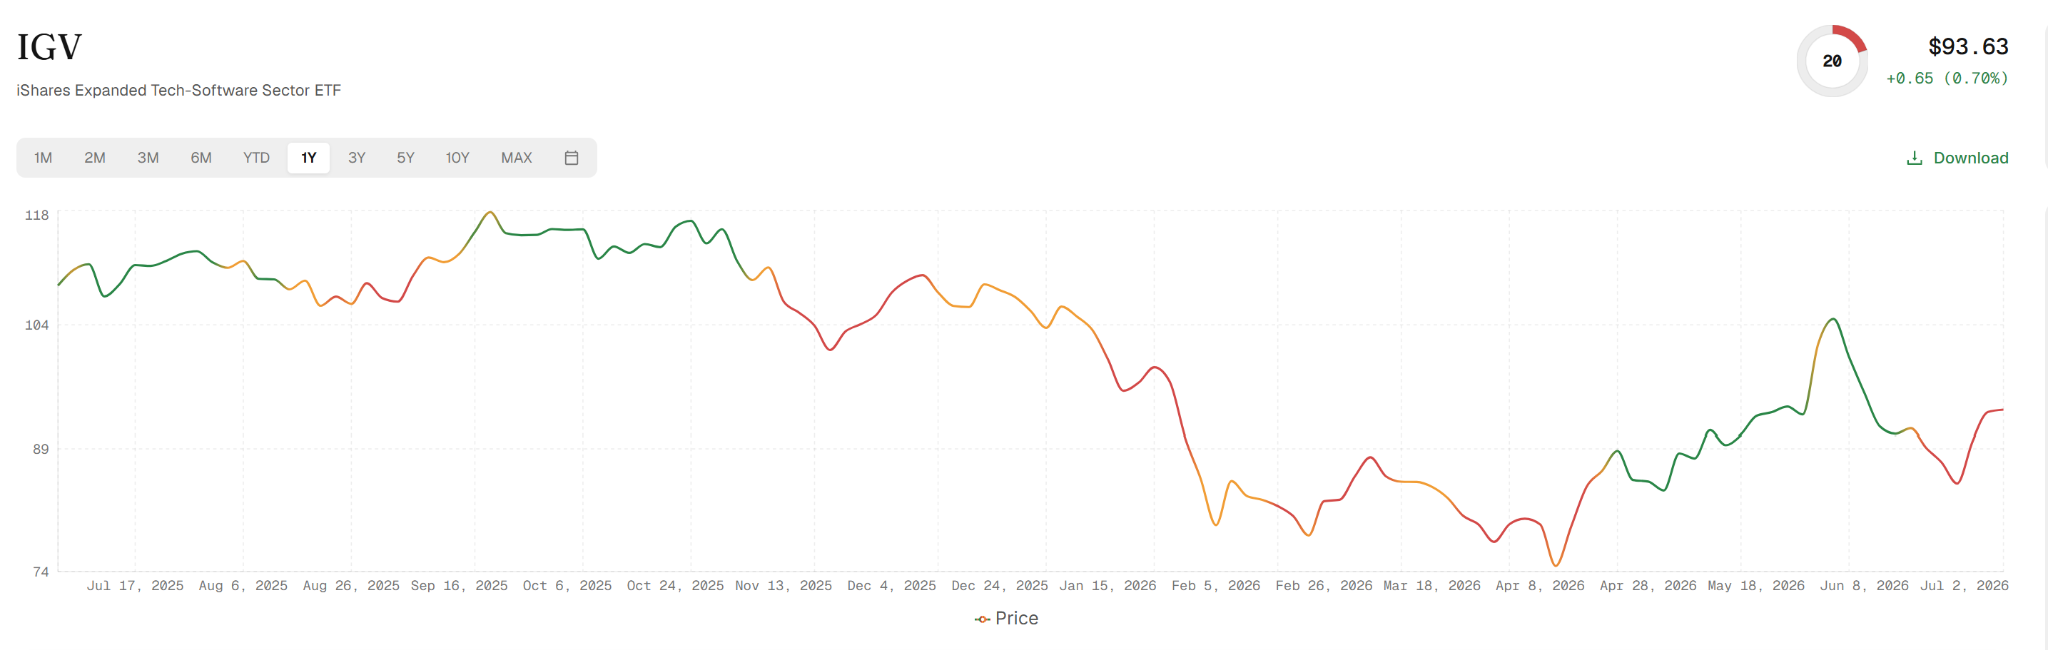
Looking at shorter-term trends, IGV has shown signs of attempting to create a short-term bottom. While not a strong signal, it has already bounced 10% from its most recent decline. This follows a series of plunges since last October’s peak, which was about 25% higher. The ROAR Score analysis confirms that IGV carries a higher risk, with a score of 20 indicating much higher than average risk. However, if the score increases to 40, it could signal a more bullish outlook.
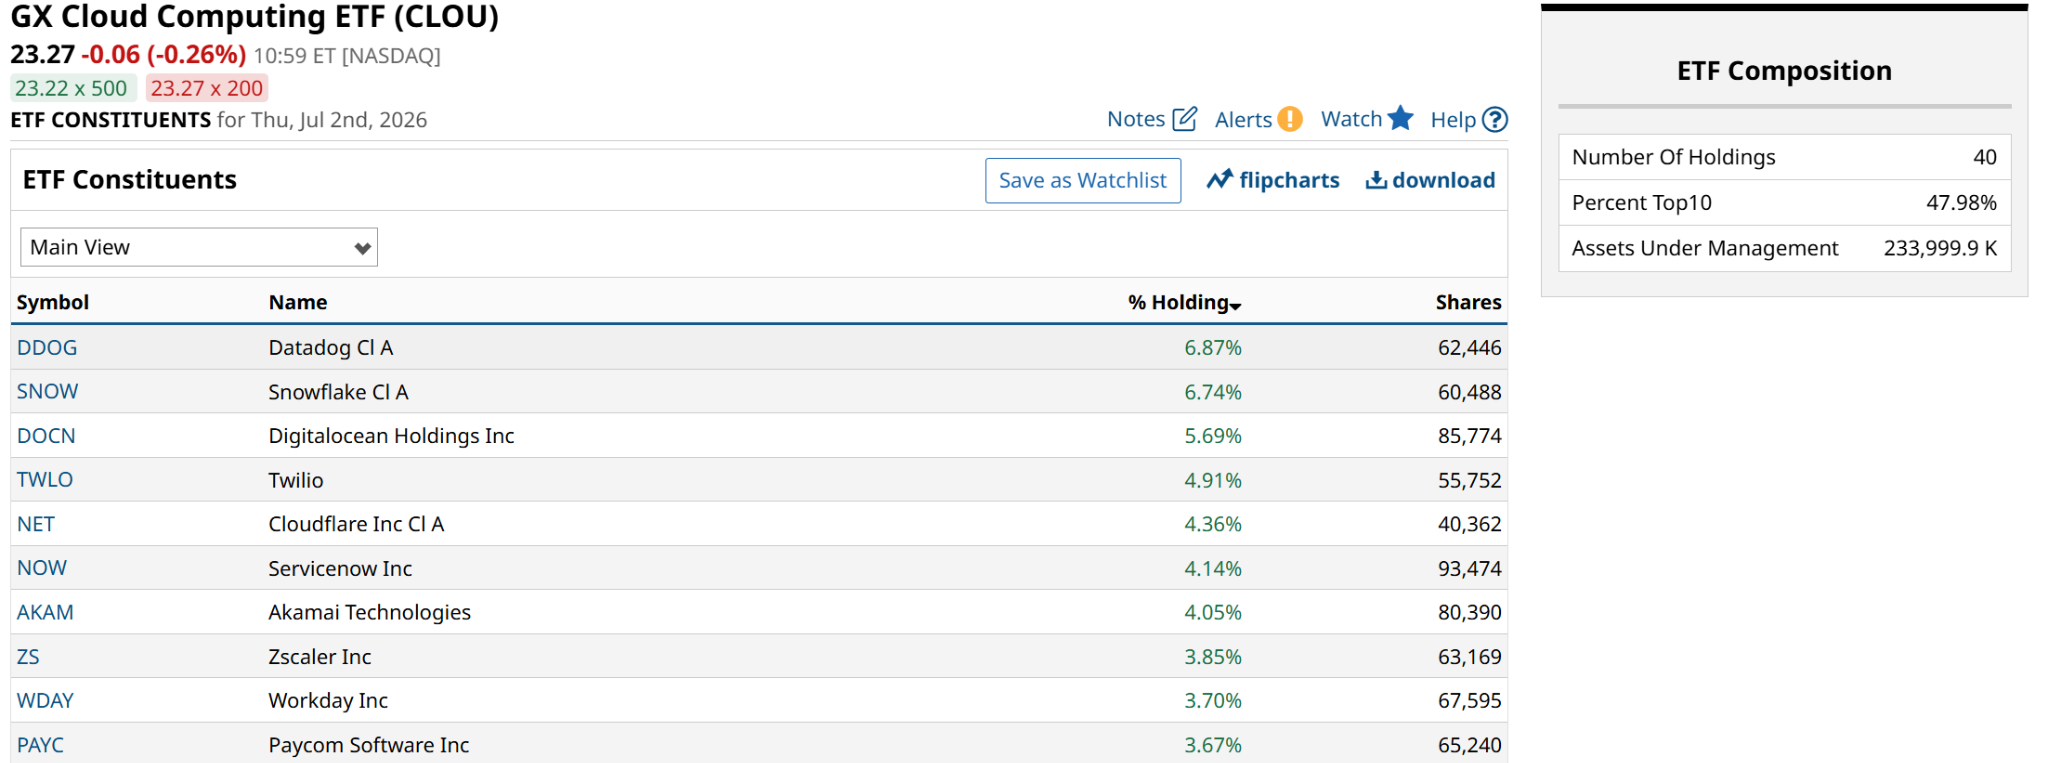
Another ETF to watch is the Global X Cloud Computing ETF (CLOU). Its top 10 holdings make up nearly half of this $230 million-plus ETF. The bullish thesis suggests that cloud stocks will benefit from increased data workloads driven by AI adoption. Efficiency improvements and open-source models could reduce query costs, leading to a surge in data consumption.
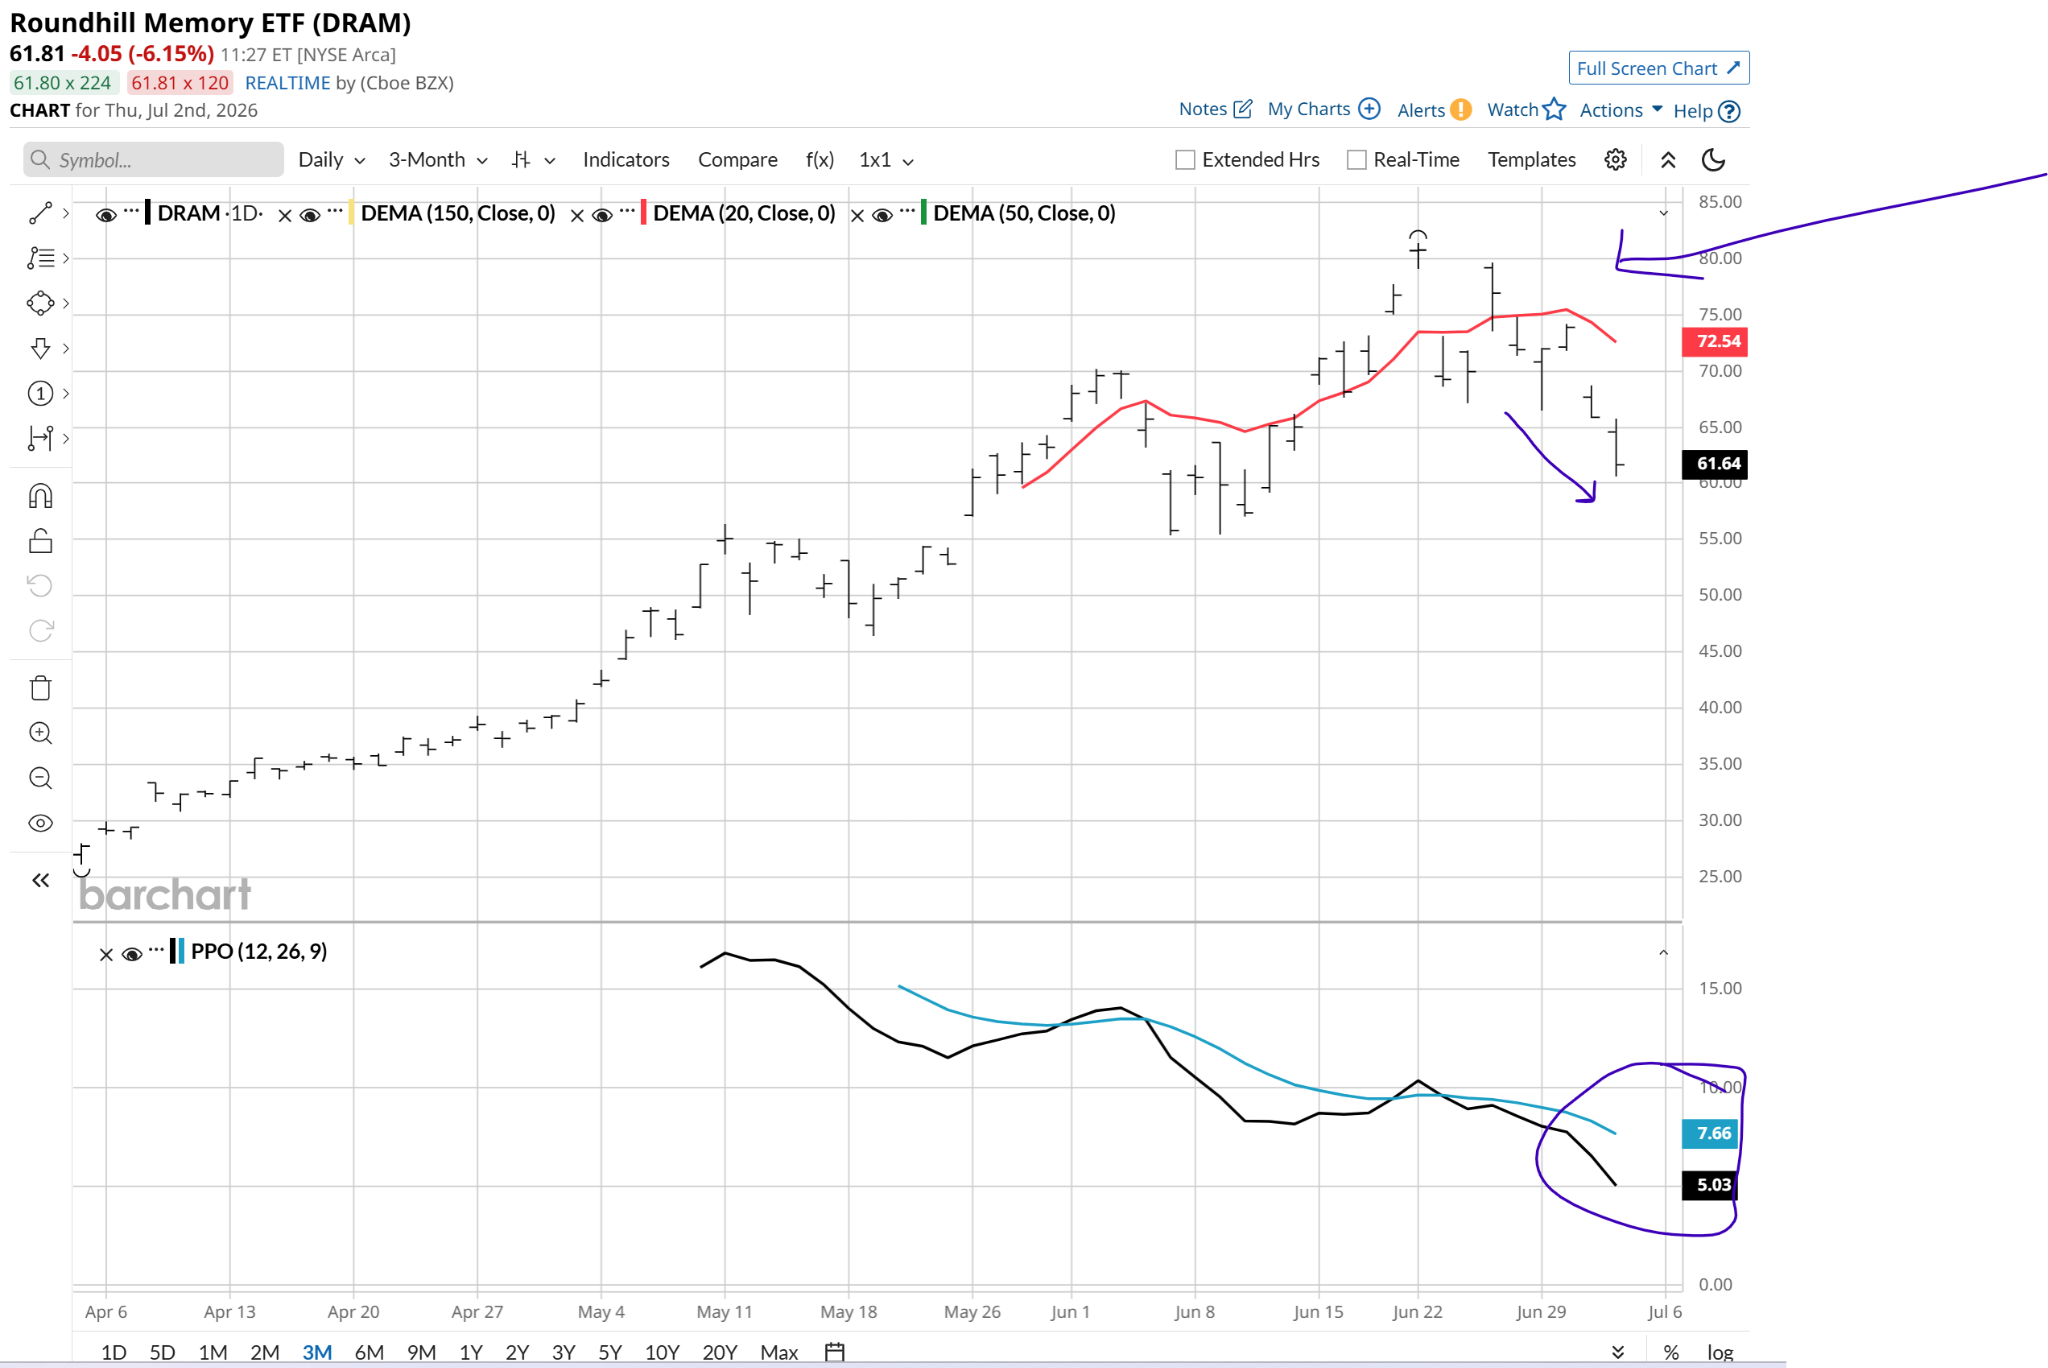
On the other hand, memory stocks like the Roundhill Memory ETF (DRAM) have seen a sharp rise but are now showing signs of exhaustion. DRAM, which has only been listed for three months, presents a bearish outlook based on current trends.
This situation reflects the stock market’s ongoing theme of "haves and have nots." However, it's not uncommon for recent winners and losers to swap positions soon.
Conclusion
Rob Isbitts, who created the ROAR Score based on his 40+ years of technical analysis experience, emphasizes the importance of managing risk and creating personalized portfolios. For more information on his research, visit ETFYourself.com.
On the date of publication, Rob Isbitts did not have (either directly or indirectly) positions in any of the securities mentioned in this article. All information and data in this article is solely for informational purposes. For more information, please view the Disclosure Policy here.


No comments:
Post a Comment