
 Trading The Close Market Recap: 06/09/2026
Markets opened higher on Tuesday before a sharp reversal sent the major indices into key technical support. A strong afternoon bounce prevented immediate breakdown confirmation, but the recovery did not erase the larger risks building beneath the surface. Rising yields, semiconductor weakness, energy volatility, and geopolitical tension remain the pressure points traders must monitor heading into CPI.
In this afternoon's Trading The Close Market Recap, Pro Trader Drew Dosek at Verified Investing broke down the technical mechanisms behind today's price action. From breakout retrace patterns on the major indices to macroeconomic parallels echoing the summer of 2023, today's analysis outlines a framework for navigating a complex and increasingly pressured market environment.
The S&P 500 and Nasdaq: The Anatomy of a Breakout Retrace
To understand the significance of today's recovery, look at the daily candle on the S&P 500. The long lower wick reflects intense intraday selling pressure that was ultimately absorbed by buyers into the close.
After appearing poised for a green session until 9:50 AM, the S&P 500 sold off sharply, driving price action directly into the top of a previously established parallel channel. This is what technical analysts call a "breakout retrace play." When an asset breaks out of a long-term channel, it frequently returns to test that former resistance line to determine whether it will act as support. Given how far the S&P 500 had extended above this breakout level, the eventual retracement carried the potential for a sharp move.
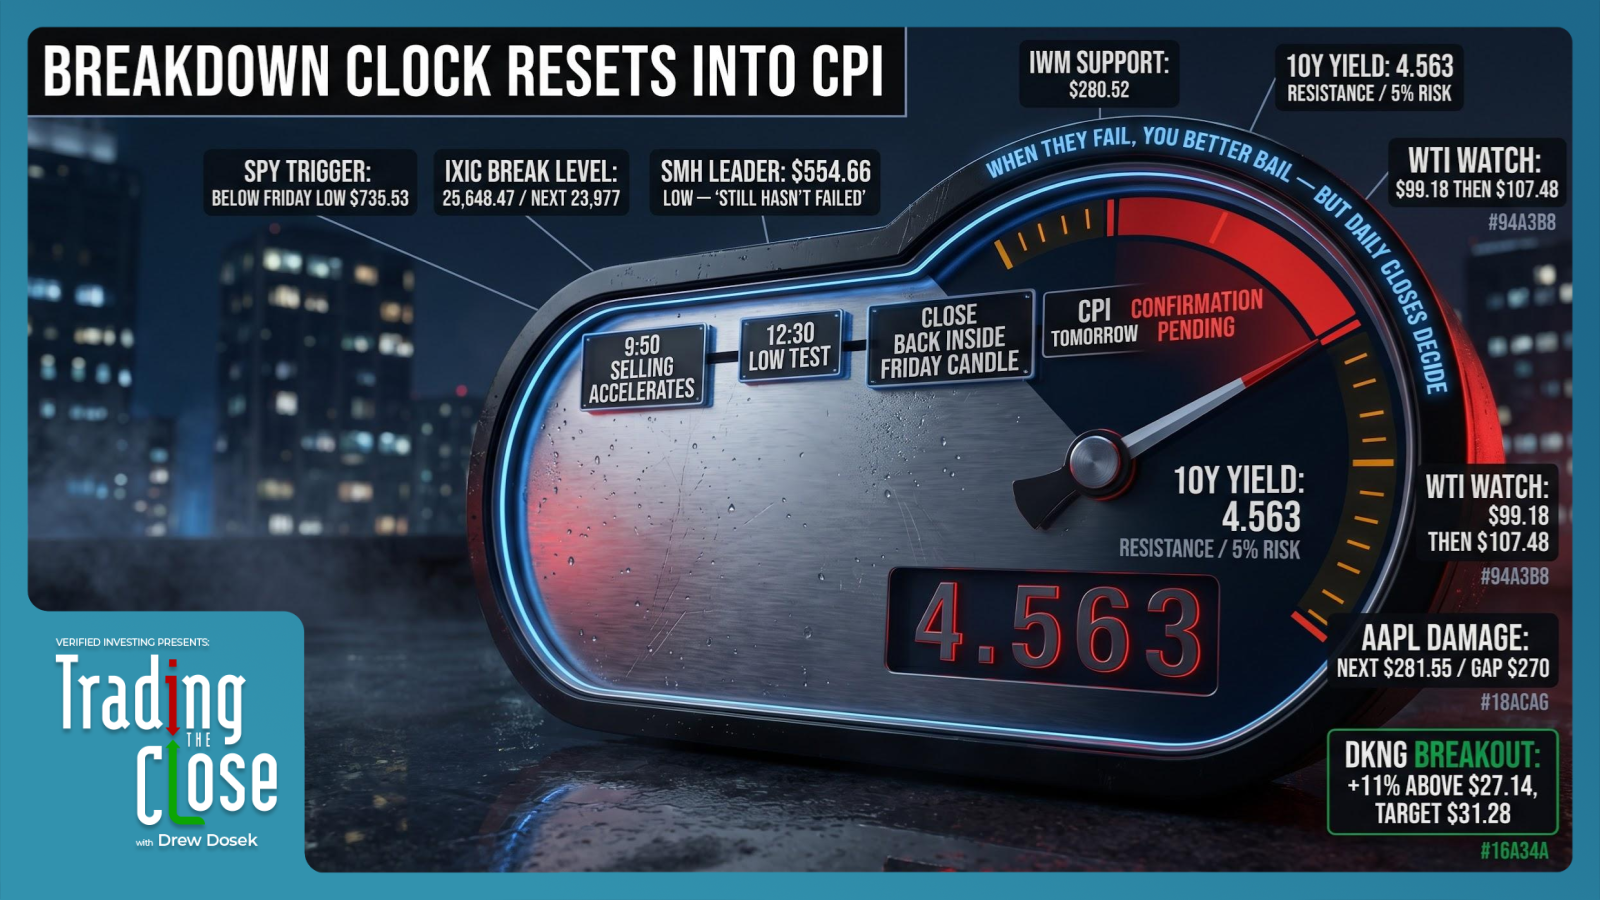
The afternoon bounce was significant - closing back within Friday's large red candle - but the index is not out of the woods. Using SPY as the tradable proxy, Drew identified Friday's low at $735.53 as the critical level to monitor; a daily close beneath that level would meaningfully increase the probability of sustained near-term downside.
The Nasdaq Composite (IXIC) paints a similar picture. The tech-heavy index also retested the top of its parallel channel before bouncing to close within Friday's red candle. However, repeated tests of a support zone carry a cost. Each successive test increases the stakes of the eventual close. Drew noted that a daily close under 25,648.47 would confirm a breakdown, opening the door to the next major support zone near 23,977.
The Macro Trifecta: Echoes of the 2023 Correction
Technical patterns reflect macroeconomic realities. The market is currently grappling with a combination of economic data and geopolitical stress that bears a meaningful resemblance to a specific recent correction.
As Drew highlighted, the summer of 2023 saw an 11% market correction driven by a trifecta: the 10-year yield climbing to 5%, surging energy costs, and resilient labor data that kept the Federal Reserve from pivoting. Today, a comparable setup appears to be forming.
Last week's stronger-than-expected jobs reports have kept the labor market looking stubbornly firm. Simultaneously, the 10-year yield is forming a bull flag on the monthly chart. Today, the yield tested resistance at 4.563%. If this pattern resolves upward and breaks the 5% threshold, it would place significant valuation pressure on equities - consistent with what markets experienced in 2023.
Add to this the headwinds of potential tariffs, the complete pricing out of rate cuts (with the Fed now discussing rate hikes), and escalating geopolitical tensions - underscored by Iran's confirmed shoot-down of a U.S. Apache helicopter near the Strait of Hormuz at midday, which triggered a wave of intraday volatility.
"Keep your emotions at bay. It'll help you stay on the right side of a trade," Drew advised. For equities to sustain an upward trajectory, the market needs the 10-year yield and oil prices to cool. Until that happens, rallies should be evaluated cautiously.
Semiconductors: The Leading Indicator Traders Are Watching
In the current AI-driven market cycle, the semiconductor sector has become the primary engine of equity performance. Mega-cap tech capital expenditure flows directly into chipmakers, making the SMH (Semiconductor ETF) a leading indicator worth watching closely.
"When the semis are doing well, you're doing well in the markets to propel, to move up, but when they fail, you better bail," Drew noted.
The SMH is walking a tightrope. It closed back within Friday's red candle and has not yet confirmed a breakdown from its inclining trend line. Drew identified $554.66 as the line in the sand - a daily close beneath that level would confirm weakness. Until that happens, the AI narrative remains technically intact, even if under pressure.
Marvell and Qualcomm: Precision Technicals in Action
Individual semiconductor names are exhibiting elevated, speculative behavior. Marvell Technology (MRVL) is a prime example of what happens when a stock enters pure momentum mode. Following comments from Nvidia's Jensen Huang suggesting Marvell could be the next trillion-dollar company, the stock moved sharply higher - from around $91 in March to over $300.
Parabolic moves eventually face technical retracements. Marvell has not yet retested the top of its parallel channel at $241.67, nor the 50% area at $227. It also hasn't retested the breakout of its inclining trend line dating back to March 2024. For swing traders, Drew identified these untested levels as potential bounce zones when the speculative momentum cools.
Qualcomm demonstrated the precision of key technical levels during today's selling. The stock suffered a sharp intraday plunge but caught a bounce at a level Drew had identified in advance: the 50% area of its parallel channel at $193. Today's low was $192.67. That reaction showed market participants were closely watching the median line. If Qualcomm fails to hold $193 going forward, Drew's next support target sits at $174.68, with upside resistance at $226.30.
Apple's WWDC: The Reality of "Sell the News"
While semiconductors work to hold support, Apple is providing a textbook example of a sell-the-news event. Despite hosting its WWDC conference and announcing updates to Siri, the stock has sold off sharply over two sessions, erasing all gains accumulated since May 8th.
Why does a stock sell off on seemingly positive announcements? Because in markets, expectations are frequently priced in ahead of the event itself. As Apple moved to all-time highs ahead of the conference, the market had already built in expectations for a significant AI development. When the announcement didn't deliver a paradigm shift, the heavy-volume reversal suggests meaningful distribution into the event-driven buying.
Apple's chart now shows near-term technical damage. It failed to hold the bullish consolidation that had pushed it above its parallel channel. Price has been sent back to test the previous all-time high as support. If that level fails, Drew is watching $281.55, followed by a gap fill zone around $270.
Commodities and Crypto: Diverging Paths
Macro tension is creating fractures across commodities and crypto, with several key assets testing or breaking critical technical levels.
Gold and Silver:
Gold confirmed a breakdown out of its parallel channel, flipping the channel bottom into resistance at $4,405. Any near-term bounce is likely to face selling pressure there, or slightly higher at $4,494. Drew's downside targets are $4,189 and the March low pivot at $4,098.
Silver is exhibiting even more weakness, breaking beneath its inclining trend line today. That trend line now acts as resistance at $72.77. Drew's downside support targets will be confirmed in follow-up coverage once the chart levels are finalized.
Energy Markets:
Despite Iran's confirmed shoot-down of a U.S. Apache helicopter near the Strait of Hormuz, oil showed relative restraint. After an intraday volatility spike, it held the lower range of an inclining trend line (a pennant pattern that has been forming since the conflict began). If the situation escalates and oil breaks higher, Drew identified declining trend line resistance at $99.18, followed by $107.48 and $111.71.
Natural Gas remains in a sideways consolidation above its inclining trend line. Repeated tests of the support line increase the importance of the eventual close. A daily close below $3.15 would confirm weakness; continued defense of that level could support a move toward the bottom of the parallel channel at $3.33.
Bitcoin:
Bitcoin is contending with its parallel channel. After two daily closes inside the channel, today's price action slipped back outside of it. Each retest of a resistance level erodes its significance. With the daily RSI sitting below 30, Bitcoin is technically oversold, increasing the probability of a near-term bounce, with Drew identifying first major resistance at $65,000.
The Psychology of Confirmation: The DraftKings Example
In a market with frequent false breakouts, waiting for technical confirmation is essential. DraftKings offered a useful case study today.
Driven by news that prediction market betting grew significantly - accumulating $1.3 billion over the last month - DraftKings surged over 11%. More importantly, it closed above a resistance level at $27.14 that it hadn't cleared since February.
However, one daily candle does not make a trend. A break above a major resistance level is meaningful, but durability requires confirmation. To flip $27.14 from resistance into support, DraftKings needs a second daily close above today's highs. If it achieves that, Drew sees a clearer technical path toward the next resistance at $31.28. Waiting for that second close is the discipline that separates reactive trading from probability-based positioning.
Conclusion: Discipline in the Face of Volatility
As markets look toward tomorrow's CPI release, the tape is sitting at an inflection point. The afternoon recovery demonstrated that dip-buying reflexes remain embedded in market participants. But the structural headwinds - rising yields, persistent inflation, semiconductor pressure, and geopolitical risk - haven't been resolved.
The key takeaway from today's session is the importance of daily closing prices. Intraday swings will shake out emotional positioning, but the daily close provides a clearer read on whether buyers or sellers controlled the session. Whether it is SPY defending $735.53, the Nasdaq holding 25,648.47, or SMH maintaining its trend line, these levels provide the objective framework for trading without emotion.
Understanding where price closed relative to these boundaries - and why - is what turns market noise into actionable information.


No comments:
Post a Comment